
The New Orleans Police Department issued an interesting press release on April 22, 2015 highlighting a report published by the Sunlight Foundation on how well Louisiana reports criminal data (spoiler alert: not very). Although the report claims data sharing at the statewide level isn’t very good, it notes that New Orleans is surprisingly effective in its practices. This type of transparency is critical for the public being able to truly analyze gun violence, so it would be useful to explain what New Orleans has made available and how it can be used analytically.
From the report:
“Since 2011, the NOPD has made its detailed calls for service data, also known as 911 call data, available on New Orleans’ open data portal. This data is downloadable in many open formats and includes information on location, time, event type and case status. In addition to the calls for service data, the NOPD publishes quarterly Uniform Crime Report (UCR) statistics and daily major offense logs in PDF format. This amount of publicly available information is uncommon for a municipality and places New Orleans ahead of the curve.”
The city’s placement of these data sources online allows anybody with Internet access to evaluate the city’s performance (since 2011) with regard to a variety of different crimes. However, making the raw data available isn’t sufficient to understand gun violence or to analyze the city’s performance against it. One must organize the data first into a usable format.
There are various ways to look at these data, but a quick tutorial about what some of the columns contain may be useful.
Four columns within the chart are most useful for evaluating gun violence. They are: NOPD Item Number, Type, Time/Date and Disposition (named NOPD_Item, Type_, TimeCreate and Disposition in the actual file).
- Item Number is a unique identifier used by NOPD for each individual incident. Item numbers are made up of three pieces: the month, the number, and the year. Months are lettered A-L: A is January, B is February, and so on through L as December. Next comes a set of five digits beginning with 00001 to indicate which number the incident was in that month. The final piece is a two-digit number for the year. Thus, the first incident of 2014 was A0000114, while the last was L3594514. Item numbers can be displayed with dashes between each of the parts, so you might see those displayed as A-00001-14 or L-35945-14.
- Type is the signal code given to each individual crime. Project NOLA has a thorough glossary, but for the sake of analyzing gun violence we are mostly concerned with 34s (an aggravated battery by shooting or non-fatal shooting) and 30s (homicide by shooting or fatal shooting).
- Time/Date is a fairly obvious description of the time and date of the incident.
- Disposition is a critical column because it explains what happened after the 911 call was made and the NOPD officer began his/her initial investigation. The disposition category essentially describes whether there is reason to believe a crime actually took place. If there is insufficient evidence of a unique incident, then the officer will assign a disposition of UNF (unfounded), NAT (necessary action taken), GOA (gone on arrival) or VOI (void). If multiple 911 calls were made regarding the same incident, then all but one item number will receive the DUP (duplicate) disposition. If the incident is confirmed and unique, then the officer will give the incident a disposition of RTF (report to follow). There’s a PowerPoint presentation on how the NOPD classifies crimes available here if you’re interested.
In theory, every item number with signal 34s and disposition RTF should represent a non-fatal shooting incident, and every item number with signal 30s and disposition RTF should represent a fatal shooting incident. Of course, there will be shooting incidents initially reported as non-fatal where the victim later dies; we can correct for those thanks to NOPD providing charts like this one that give the item number of every homicide in a given year. Incidents should be treated as binary, either fatal or non-fatal, so using that table can help correct the list of non-fatal shooting incidents.
There will also be instances that, for one reason or another, were not included in the initial calls for service list. Sometimes there will be shooting incidents initially identified as an armed robbery (64g) or officer in need of assistance (108). Human error also happens sometimes. Fortunately there is a way to correct these potential oversights by reviewing NOPD’s Major Offense Log and identifying missing incidents.
The Major Offense Log is a summary of each day’s major crimes produced by NOPD. These documents contain each incident’s item number, signal, a bit about the victim/perpetrator and a short description of the incident. NOPD has put that document online for public consumption every day since August 2014, and prior to that it was hosted by Project NOLA dating to December 2010.
Sifting through all these data is an arduous task, but the end result is a database of every fatal and non-fatal shooting incident in New Orleans since 2011. Incidents can then be counted day by day starting in January 2011, and analysis can be performed. One analytic technique is to assign each day an annualized pace based on the number of shootings to that point of the year. Trends can be compared on a year by year basis or one big chart can be created showing rolling trends over the last 4+ years.
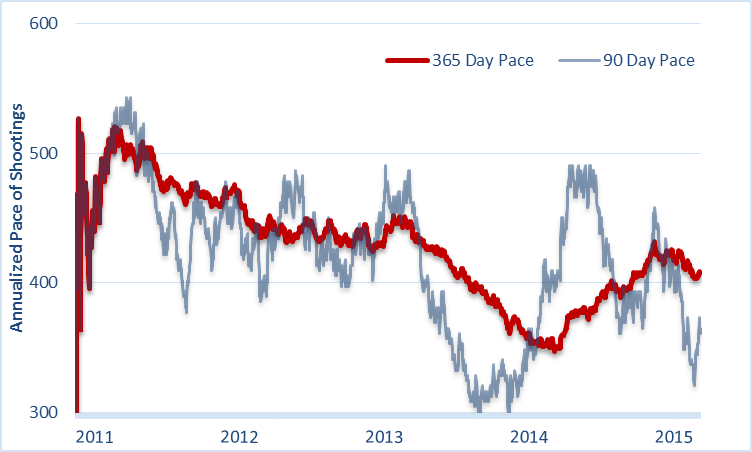
The latter result is partially represented in the figure below. This graphic shows the rolling pace of all shooting incidents in New Orleans since the start of 2011. In this case, each day from January 1, 2011 to present is assigned a 365 Day Pace and a 90 Day Pace.
The 365 Day Pace represents the number of fatal and non-fatal shooting incidents over the last 365 days while the 90 Day Pace helps accentuate positive and negative trends by taking the number of shootings over the previous 90 days and annualizing how many shootings would take place at that rate over the course of a full year.
Looking at the data in this manner enables a full re-creation of every shooting incident (both fatal and non-fatal) on every day dating back to January 2011. The public is then in a position to analyze gun violence without waiting for quarterly reports from local or federal sources.
A disclaimer: These data are not perfect and therefore this approach to analyzing gun violence is not perfect. Just because a 911 call was placed and an officer wrote an initial report does not mean the incident actually happened. For example, a person may call 911 to say that they were robbed at gunpoint. The officer may come out and interview the alleged victim, write a report and hand things off to the assigned detective who later discovers that the victim fabricated the whole thing.
The data quality issue is lessened when analyzing gun violence because there are fewer instances of an officer writing a report on an incident where a person was shot only to find out later that the person was not criminally shot. But it does happen. For instance, there are times when a person accidentally shoots himself or herself but claims to have been shot by someone else. There will also be times when a person might commit suicide, but the incident will initially be reported as a fatal shooting.
As the old Russian saying goes, “better is the enemy of good enough.” This analytic system may not capture gun violence in New Orleans with perfect accuracy, but it is a very close tabulation that allows for an honest and effective analysis of trends since 2011. It’s also a much better method for analyzing gun violence than anything that UCR provides, as was discussed in my last post.
Establishing the initial data set can lead to several different analyses on gun violence. This method enables the description of trends, an evaluation of ongoing law enforcement and social programs, insight into why murder is rising or falling, and an ability to bust prevalent myths.
My goal is to look into all of those areas over the next couple of months. My next post, however, will try to answer the question “What does this method say about the impact of New Orleans’ murder reduction program on gun violence?”

Leave a Reply